Data dashboard: Turning data into market signals
A powerful intelligence platform built to track prices, trade flows, and market signals across commodities.
All the intelligence you already trust from BigMint, now mapped into interactive dashboards.
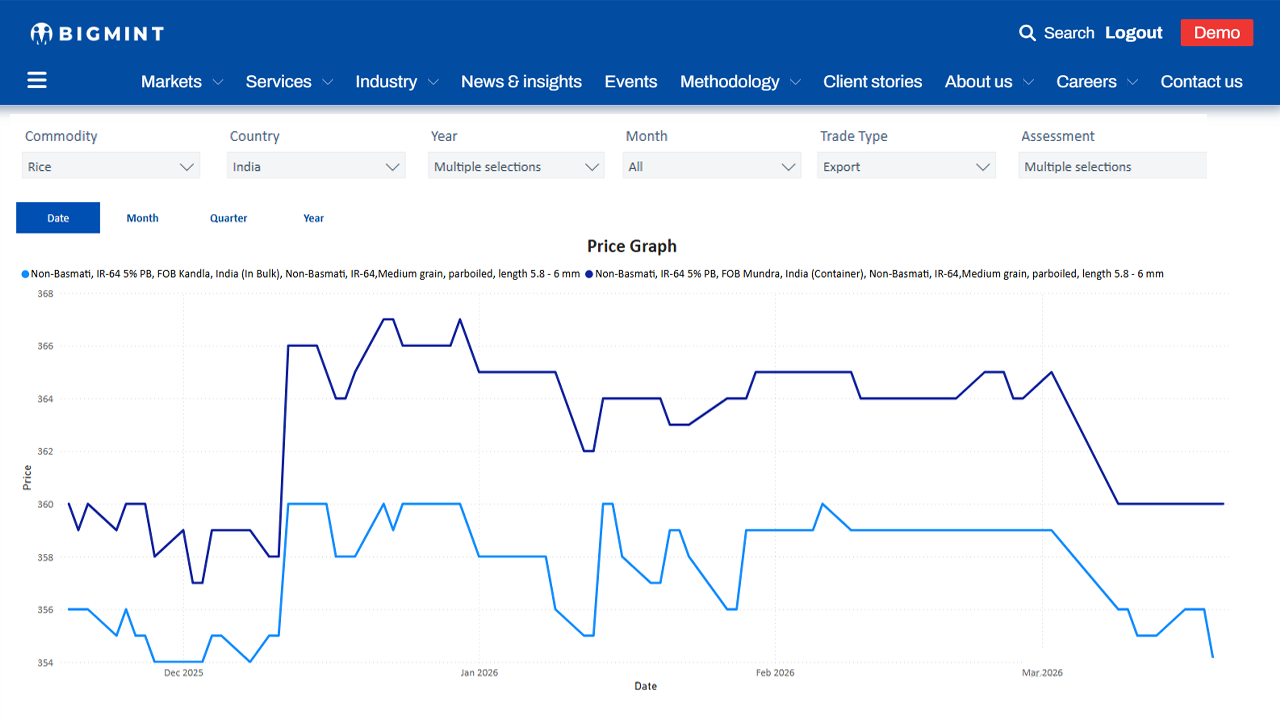
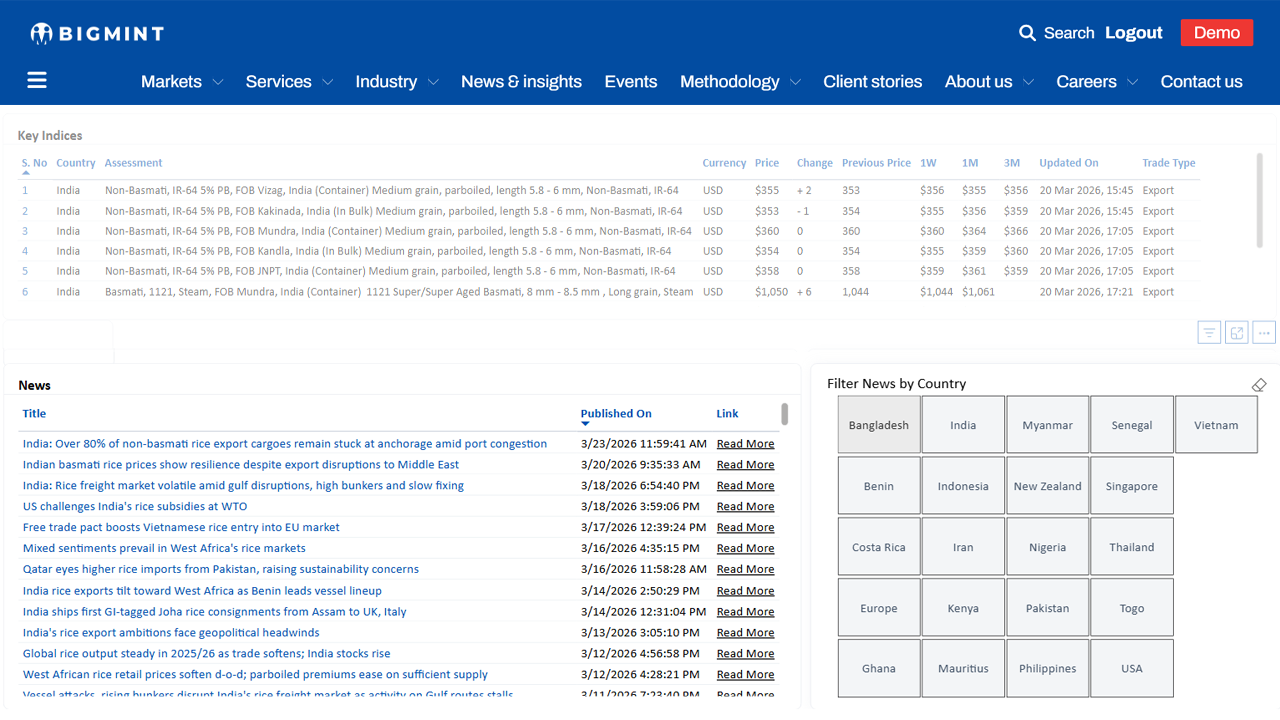
Track benchmark price indexes and analyse historical movements through interactive time-series charts, helping you identify trends, cycles, and market direction over different time horizons.
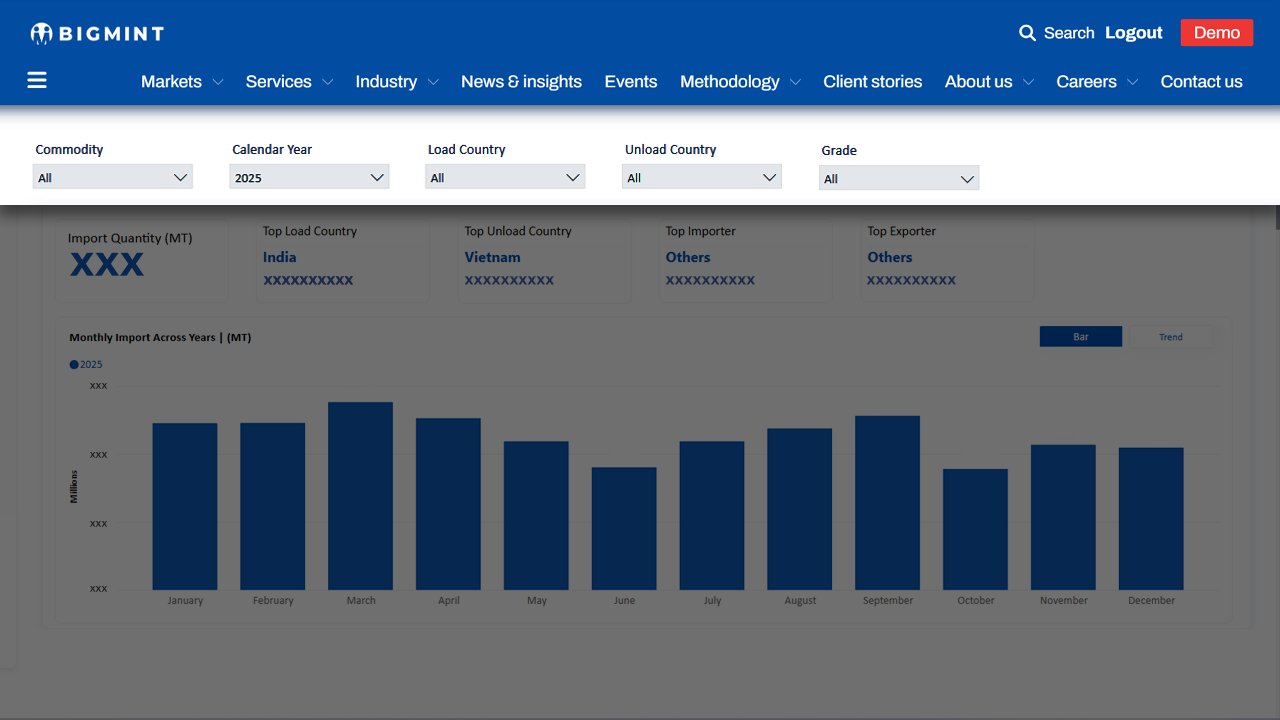
Monitor cross-border trade flows with detailed import and export data, enabling you to understand regional demand, supply shifts, and their impact on market dynamics.
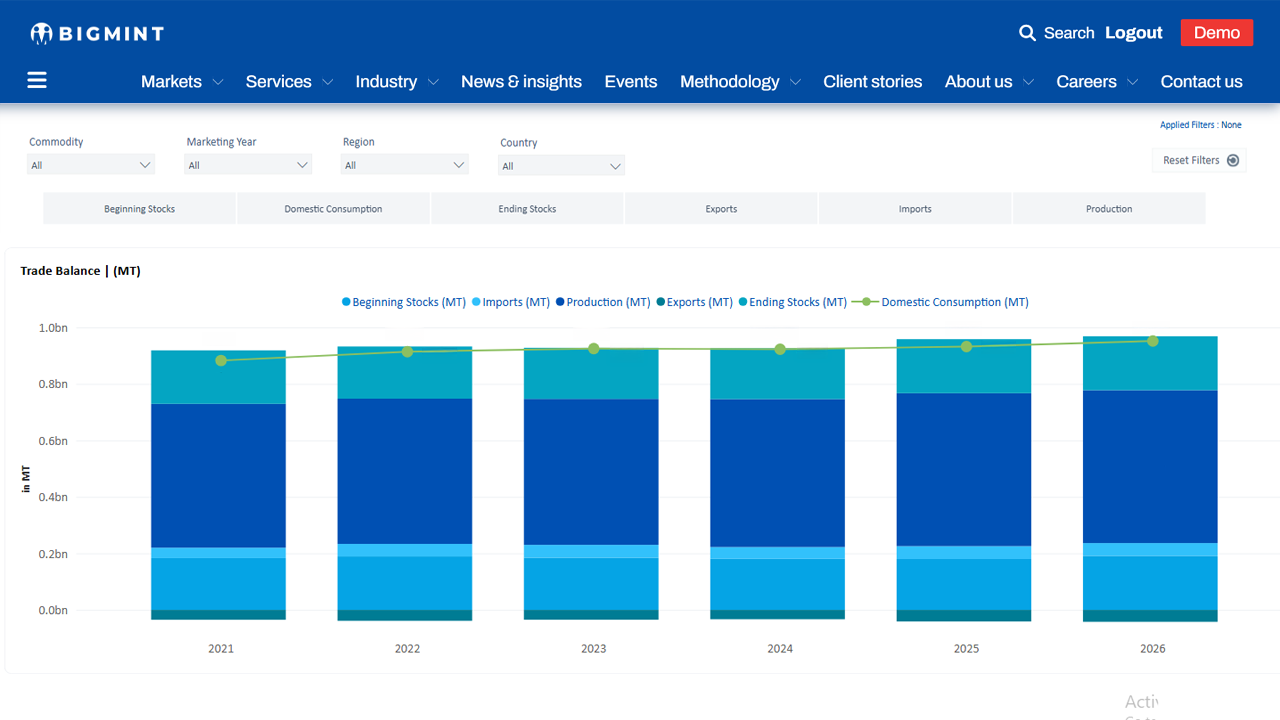
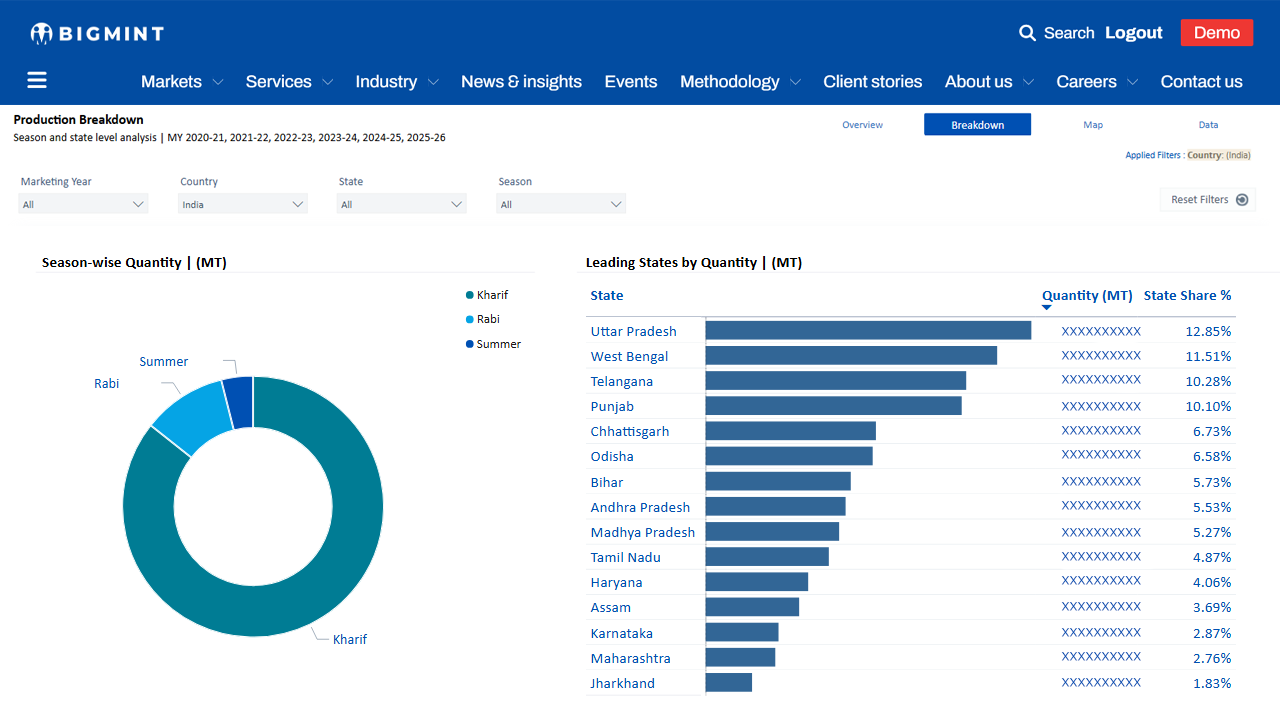
Stay updated on production levels, consumption patterns, and supply indicators to better interpret market availability and anticipate potential price movements.
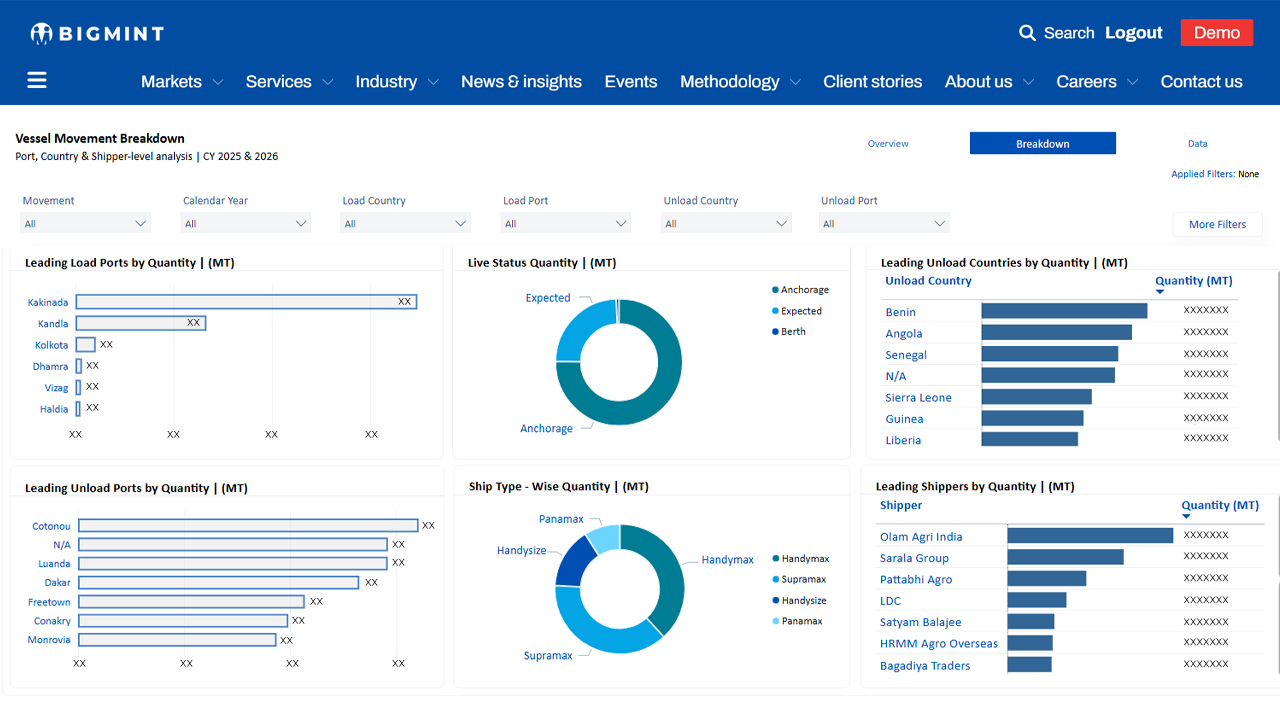
Track logistics trends, including shipment activity, freight movements, and material flows, providing context on how transportation and supply chain developments influence markets.
Access curated market insights and relevant news aligned with each commodity, helping you understand the key events, policies, and developments driving price movements.
Customise dashboard views using powerful filters to analyse specific grades, regions, ports, or time periods, making it easier to focus on the data most relevant to your decisions.
Discover how interactive dashboards help you analyse markets faster and make informed decisions.
Stay ahead with BigMint! unlock smart insight, transparent pricing, and global data for better decisions every day.